
by Philippe GARCELON
This article is based on the work done by the researchers David Porco, and Louis Deharveng (National Museum of natural history) who exploit the genetic tool and were kind enough to send me documents related to their research on Springtails.
Introduction
Despite the emergence of genetic identification techniques, on the basis of the DNA barcode, biologists still define the majority of species by means of determination keys derived from the observation of their common characteristics, Starting from the most general to the most specific. This work requires the collection of live specimens or sufficiently well preserved to allow exhaustive listing of their morphological details.
Currently, the use of the DNA barcode is essentially the result of laboratories specialized in genetics. The new species are therefore still and primarily subject to detailed morphological descriptions. However progressively appear studies on the DNA barcode which significantly impact the work of the taxonomists.
NB: As a result of this article, you will find some additional information which, without being indispensable to its reading, allows a better understanding of the latter.
“Traditional” taxonomy
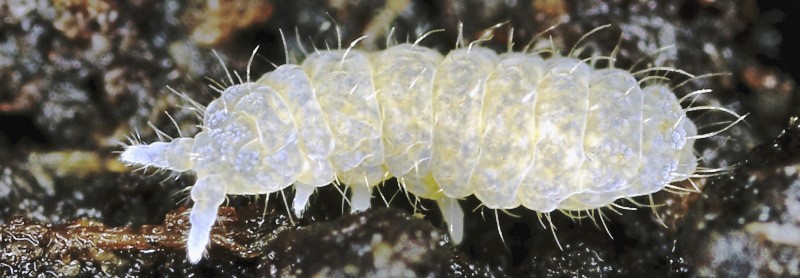
Here I take a description of the morphological peculiarities of a new species of Collembolan Deutonura gibbosa (Porco, Bedos & Deharveng, 2010) belonging to the subfamily Neanurinae, within the family Neanuridea (Poduromorphe).
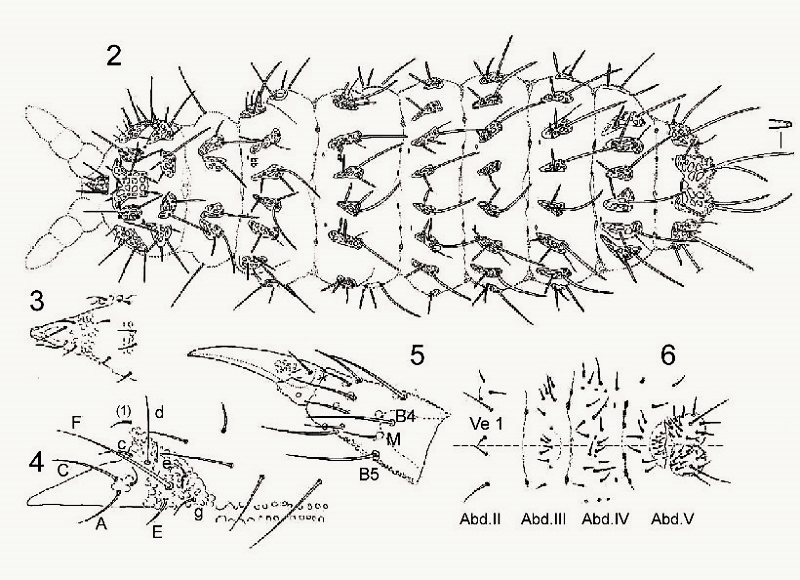
The “traditional” taxonomy lists each morphological detail in the form of an inventory comprising drawings and a summary table using a specific abbreviated terminology. In this case (Deutonura gibbosa sp. nov), “Hairs” are identified according to:
- Their nature: ML (Macroseta long), MC (Macroseta Court), Me (Mesosetae), Mi (Microsetae)
- Their implantation: I (thorax, segments i), Abd. 4 (abdomen, segment IV), Ant. 2 (antenna, second segment) etc…
- Their number
On the following board, different parts of the body are represented to list the implantation of the hairs:
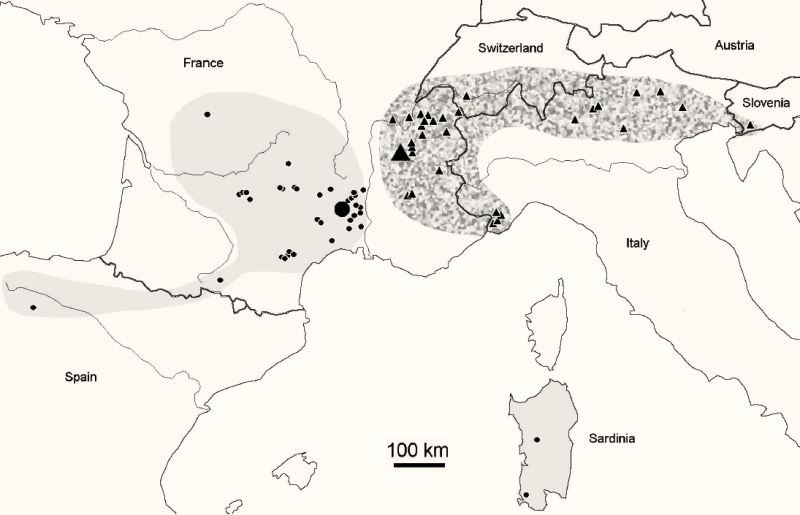
In order to accompany these descriptions, there are also maps showing the geographical distributions of the species, usually accompanied by the list of places and the number of specimens taken from them.
Cryptic diversity
If documented, these identification keys are still incomplete, as they do not reveal certain diversities, other than morphological ones. This is a cryptic diversity characterized by genetic specificity for specimens inseparable from the morphological level. This diversity was highlighted in a study (James et al. -2010) which shows that the description of the Lumbricus terrestris (earthworm) actually applied to two distinct species Lumbricus terrestris and Lumbricus herculesus. Decaëns al. (2013) estimates that an average of 30% of species defined by morphology would be cryptic species complexes. Another study (Janzen et al. 2013) shows that 32 species of Saturnidae butterflies, described morphologically, actually represent 49 genetically distinct species. These only examples illustrate this new risk called “biological chimera”, which would reduce several real species to a single denomination.
DNA Barcode – Genetic sequencing
In order to be able to go further in the taxonomic approach, the researchers approached this issue in terms of genetics. On this occasion, they noted that it was not necessary to sequence the entire DNA chain of a specimen in order to be able to discriminate against its species. Indeed, they found that the analysis of portions (sequences) of this long chain was sufficient (below):
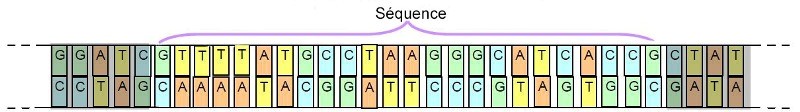
Important: To define this sequence, it is necessary to identify one that varies from one species to another, while remaining stable for the same species.
Since the mid-years 1980, bactériologues have used genetic sequencing as part of their diagnosis of bacterial infections (Legionnaires ‘ disease, some forms of meningitis, etc.). The sequenced gene is 16s ribosomal RNA. For more informat, Click here (Download PDF).
In 2003, Paul Herbert (director of the Biodiversity Institute of Ontario) and his team axent their research on the sequencing of a gene (defined portion of DNA that corresponds to a basic unit of heredity) different from a specific region of DNA Present in the mitochondrial genome of eukaryotic cells (see further information as a result of this article). This portion of DNA now becoming an identification standard corresponds to a part of the gene that codes “subunit 1 of cytochrome c oxidase”, a protein named K1 (it is a portion of the code of an enzyme “cytochrome c oxidase” indispensable to The biochemistry of the respiratory chain).
The K1 gene chosen by Herber, while responding to the first mentioned necessity, also has other advantages, such as its high rate of evolution and the fact that it allows a significant accumulation of mutation within a species. It appears, by comparisons of DNA sequences, that the K1 gene diverges sufficiently to permit discrimination of species or even discrimination of populations within the same species (Cox and Hebert 2001-Ware and Cunningham 2001).
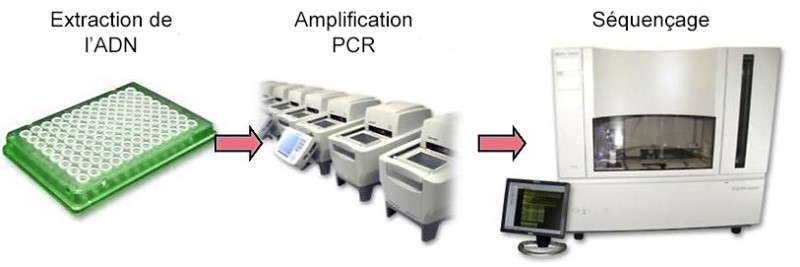
Moreover, since it is already very present within the cell which counts between 300 and 2000 mitochondria and also in the form of copies (from 5 to 10) in the mitochondria itself, it is relatively easy to multiply, by a complex biochemical technique named “PCR Amplification” (polymerase Chain reaction).
This process allows the obtaining of a very large number of copies (100 to 10 000) of a given sequence of DNA in order to have a sufficient quantity allowing the machines to ensure sequencing.
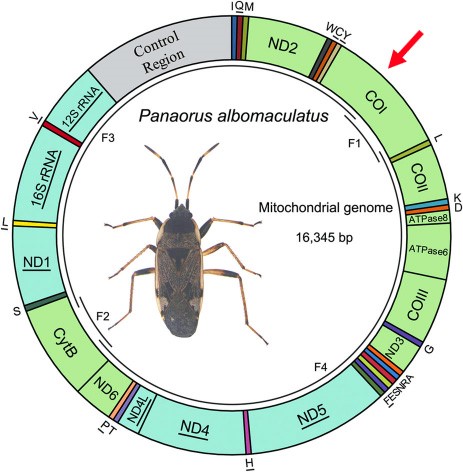
Here is an example of a map of the mitochondrial genome of a hemiptera on which divisions are distinguished, each corresponding to a gene. In the case of this insect, 13 of these genes are coding for the protein (this is the case of K1 marked with a red arrow).
The genus Deutonura, which has more than 56 species, is a major representative of the large subfamily Neanurinea, which accounts for a total of 784 (last updated to 28-03-2018). While some species such as Deutonura Phleagea (Caroli, 1912-Carrington, 1979) have a wide range, most of them have been observed in much smaller areas, some of which are narrow endemic species. The geographical distribution of Deutonera Gibbosa sp. nov, a very common species of the genus, covers the Alps and southern Jura.
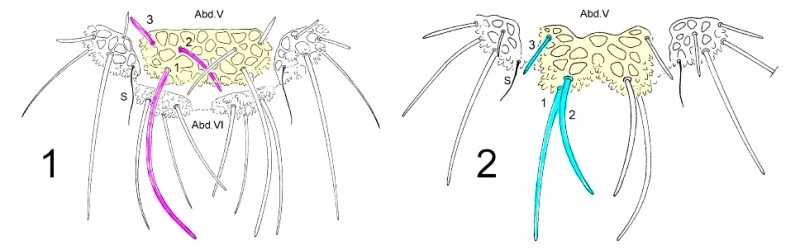
To dissociate species of the genus Deutonera, the classical taxonomy mainly takes into account the arrangement of the dorsal tubers as well as the number of hairs on each tuber. Observation of the two species, Deutonura deficiens sylvatica (Fig. 1) and Deutonura gibbosa sp. nov. (Fig. 2) shows, however, a similar implantation of the dorsal hairs and the same number per tuber. (I colorized the sketches and correlated the colors with the tables I and II of the dis
tances) The only difference as shown in the sketch below, resides in an extension and elongation of the dorso-internal tuber on ABD. V (in yellow), associated with a modification of the arrangement of the hairs (pink/blue) and their lengths on that same Tuber.
The researchers performed a sequencing of 17 specimens of 5 species of the genus Deutonura (6 d. caerulescnens, 5 D. Deficiens sylvatica, 1 D. decolorata, 4 D. gibbosa sp. nov. and 1 D. vallespirensis).
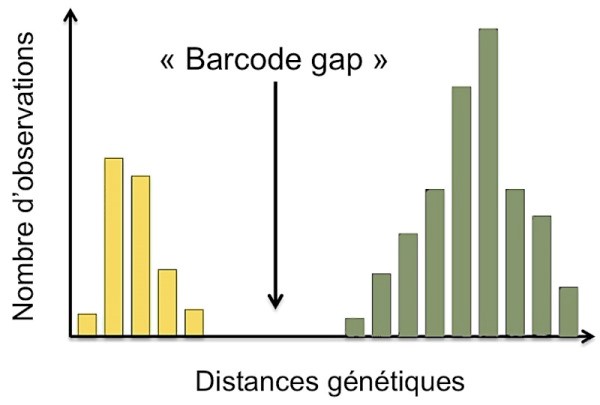
Definition: The genetic distance is an index (numerical value) proportional to the number of differences that exist between two sequences of the same gene fragment and which can take into account different patterns of evolution. For example, the following illustration shows a significant difference in genetic distances, in yellow for individuals of the same species (intra-specific) and in green for individuals belonging to different species (inter-specific).
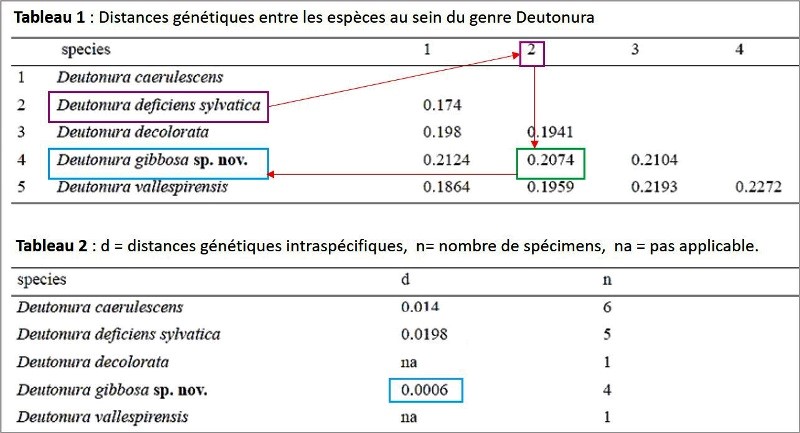
The measured genetic distances are reported in the following tables: Table. 1 (interspecific), table. 2 (intraspecific).
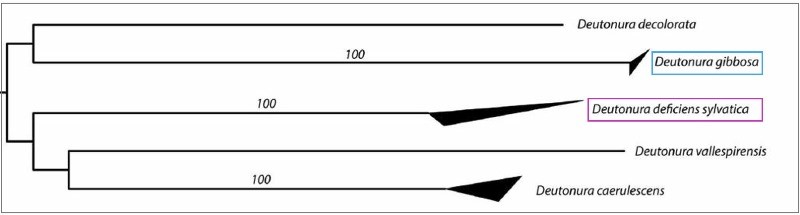
These values are also illustrated by the tree below, generated from a nucleotide transcription model called “K2P” (Kimura two parameters) on which the upper and lower sides of the dark triangles show respectively The maximum and minimum genetic distances within the species.
It is actually visualized (in blue) that Deutonura gibbosa sp. nov. (Barcoding performed with 4 specimens), has the lowest intraspecific value (0.0006) of the genus Deutonura, whereas for its nearest neighbour (in pink) Deutonura Deficiens sylvatica, the measurement made from the 5 specimens shows a distance Interspecific 0.2074.
These two intra-and inter-specific values, as well as distances characterizing other species of the same genus (Deutonura), provide genetic support for delimiting Deutonura gibbosa sp. nov as a distinct mitochondrial line.
Conclusion
As this example points out, the minimal morphological differences between two species D. gibbosa sp. Nov. and D. Deficiens sylvatica are significantly more genetically marked. This observation made in the years 2010 with which more recent studies converge confirms the potential of the genetic tool with regard to the characterization of species. More broadly, many species that are not yet described or require in-depth examinations benefit from this contribution, which increases reliability and precision. But the resources of the DNA barcode extend beyond the identification of species by more generally impacting the whole field of biodiversity.
The DNA barcode, which can be replicated as needed, allows massive analyses with considerable time savings compared to the morphological identification that has just been identified. The use of the DNA barcode thus appears today as a tool that greatly broadens the field of investigation of biologists. While the classical taxonomy requires the study of intact specimens, the genetic study accommodates various states such as eggs or larvae but also fragments of corpses, feces, mucus or other traces present in various Substrates (this is referred to as intracellular DNA analysis and extracellular DNA analysis). Thus, the analysis of a Fed’s water can reveal that a given species of frog has evolved, even if that frog could not be physically taken.
The DNA barcode also paves the way for historical reconstruction, both in terms of the separation mechanisms of two species and in the evolution of their geographical distribution (phylogeography). In this regard, D. Porco et al. (2013) showed how European Collembola introduced into North America became invasive.
The use of the DNA barcode also allows for the identification of predatory behaviours of certain species through the analysis of their diets, by sampling the contents of digestive tubes or feces. These studies provide new insight into prey/predator or host/parasite interactions (link).
But this technique has its own limitations. Indeed, researchers have sometimes found genetic similarities on morphologically distinct specimens or, for geographically isolated populations where the same species can exhibit high genetic variability. To reinforce their conclusions, scientists therefore have an interest in crossing the results of the DNA barcode with their traditional identification data.
Further information
DNA sequencingSequencing preparation requires a succession of steps which consists of tissue destruction followed by purification and “amplification” carried out in the form of a protocol that governs a series of physico-chemical operations. Mitochondrial DNA is particularly used for genome sequencing because of its intrinsic properties, including the fact that it is 5 to 10 times more specific than the nuclear DNA genome.
The sequencing is carried out in the laboratory by automated machines using a test tube containing DNA, nucleotides and primer of the DNA polymerase (derived from the PCR amplification referred to above).
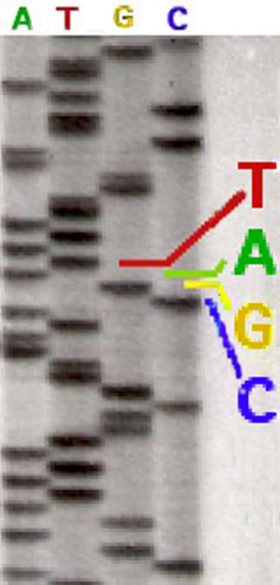
I cannot detail here the complex synthesis reactions that take place in one of these test tubes. It can only be noted that spectral analysis is possible only through the marking by different fluorochromes (A green, T red, G yellow and C blue), each color occupying distinct wavelength ranges. In the return of the analysis each nucleotide appears in a succession corresponding to its order within the sequence analyzed. The radiolabeling originally used did not distinguish one nucleotide from the other three. It was then necessary to sequence from four different tubes, each possessing a type of nucleotide. A radiolabeled sequencing could be read directly to the eye on an acrylamide gel (opposite). Today, the replacement of radioactive labeling with Fluorochromes allows the four reactions to be carried out within the same tube. The modern sequencers detect the fluorescence intensities and have software to translate the results in graphical form, as can be seen in the example below. The position of the nucleotides (A, G, T, C) named sequence characterizes the genetic information. On the upper part, the succession of the nucleotides identified by their letter and accompanied by figures which allow to situate them within the sequence studied. On the lower part, the curves of four colours correspond to the amplitude (intensity) of the fluorescences measured for each marker. In addition to this type of presentation, all information is also logged in tabular form using an international nomenclature that allows automated comparisons with existing databases. |
DatabasesGenetic databases become crucial in biology, so the publication of a scientific article describing a biological sequence is subject to the prior filing of its genetic data on one of the following three bases:
The number of whole sequences or genomes deposited there grew exponentially between 2000 and 2014, while at the same time the sequencing costs decreased in similar proportions facilitating the use of this type of Technical. Today there are hundreds of databases, which have led to the creation of a database of databases: NAR database As an indication, in September 2012 the nucleic databases accounted for, for the only invertebrates, 31,907,138 entries, a total of 52,527,673,643 nucleotides! In the specific case of the DNA barcode, there is for example a database managed by International Barcode of Life which at 02/05/2018 had in its bio-informatics platform BOLD A set of more than 6 million of DNA barcodes of which, for the reign Animal, 4,367,942 barcodes representing 154 271 species and from 238 countries. The platform also has tools to compare the DNA sequence of an unknown organism with the DNA barcode sets listed in the database. |
Sources :
• Porco D. ; Bedos A. & Deharveng L. (2010): Description and DNA barcoding assessment of the new species Deutonura gibbosa (Collembola: Neanuridae: Neanurinae), a common springtail of Alps and Jura. Zootaxa 2639, 59-68 (lien)
• “Amplification PCR- Ifremer” : http://www.bibliomer.com/
• Société Française d’Ecologie et d’Evolution : Article : “Le barcoding ADN” (T. Decaëns, D. Porco & R. Rougerie)